


CAT Line Graph Questions are part of the Verbal Ability section of the CAT exam. Through Line Graph questions, aspirants are asked to understand continuous change over a period of time. The difficulty level of the Line graph questions can be moderate to difficult.
What are some CAT Line Graph Practice Questions?
Directions (Questions 1-5): Study the following line graph carefully and answer the questions given below:
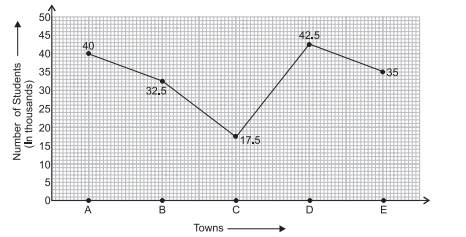
Q 1. What is the ratio of the number of students appearing for the Aptitude Test from Town B to that from Town A?
A. 3 : 4
B. 13 : 16
C. 11 : 16
D. 2 : 3
E. None of these
Answer: Ratio of number of students from Town B to that from Town A
.png)
Q 2. What is the average number of students appearing for the Aptitude Test from all the towns together?
A. 33500
B. 3350
C. 17500
D. 33.5
E. None of these
Answer: Average number of students appearing in Aptitude Test from all towns
.png)
Q 3. The number of students appearing for the Aptitude Test from Town E is approximately what percent of the total number of students appearing for the Aptitude Test from all the towns together?
A. 15
B. 17
C. 19
D. 21
E. 23
Answer: Average number of students appearing in Aptitude Test from all towns together
.png)
Q 4. What is the ratio of the number of students appearing for the Aptitude Test from Towns C and D together to the number of students appearing for the Aptitude Test from Towns A, D and E together?
A. 11 : 13
B. 20 : 43
C. 20 : 47
D. 37 : 20
E. None of these
Answer: Ratio of students appearing in Aptitude Test from towns C and D
.png)
Q 5. The number of students appearing for the Aptitude Test from Town D is approximately what percentage of the number of students appearing for the Aptitude Test from Town C?
A. 243
B. 413
C. 134
D. 341
E. 143
Answer: Percentage of number of students appearing in Aptitude Test from town
.png)
What are the must-do Line-Graph questions for the CAT exam?
Directions (Questions 6–7): Study the following graph and answer the questions that follow:
The table given below represents the ratio of the production (in tonnes) of Company A to the production (in tonnes) of Company B and ratio of sales of Company A and Company B.
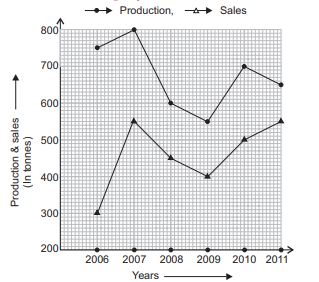
Q 6. What is the approximate percentage increase in the production of Company A from 2009 to 2010?
A. 18%
B. 38%
C. 23%
D. 27%
E. 32%
Answer: Production of company from 2019 to 2010
.png)
Q 7. The sales of Company A in the year 2009 was approximately what percent of its production in the same year?
A. 65%
B. 73%
C. 79%
D. 83%
E. 69%
Answer: The sales of company A
.png)
What were the previous year's CAT Line Graph questions?
Directions (Questions 8–13): Study the following graphs carefully and answer the questions that follow:
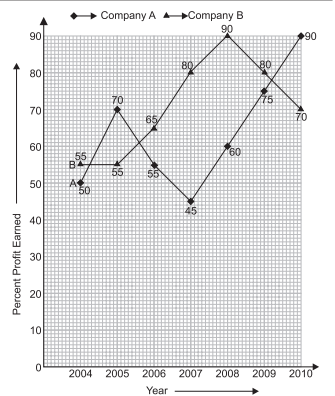
Q 8. If the profit earned in 2006 by Company B was 812500, what was the total income of the company in that year?
A. 1250000
B. 2062500
C. 1650000
D. 1825000
E. None of these
Answer: Profit earned in 2006
.png)
Q 9. If the amounts invested by the two companies in 2005 were equal, what was the ratio of the total income of Company A to that of B on 2005?
A. 31 : 33
B. 33 : 31
C. 34 : 31
D. 14 : 11
E. None of these
Answer: Two companies income in 2005
.png)
Q 10. If the total amount invested by the two companies in 2009 was ` 27 lakh, while the amount invested by Company B was 50% of the amount invested by Company A, what was the total profit earned by the two companies together?
A. 21.15 lakh
B. 20.70 lakh
C. 18.70 lakh
D. 20.15 lakh
E. None of these
Answer: Option E
.png)
Q 11. If the income of Company A in 2007 and that in 2008 were equal and the amount invested in 2007 was 12 lakh, what was the amount invested in 2008?
A. 1087500
B. 1085700
C. 1245000
D. 1285000
E. None of these
Answer: Income of company in 2007 and 2008
.png)
Q 12. If the amount of profit earned by Company A in 2006 was 10.12 lakh, what was the total investment ?
A. 13.8 lakh
B. 14.9 lakh
C. 15.4 lakh
D. 14.2 lakh
E. None of these
Answer: The profit earned in 2006
.png)
Q 13. If the amount invested by Company B in 2004 is 12 lakh and income of 2004 is equal to the investment in 2005, what is the amount of profit earned in 2005 by Company B?
A. 6.6 lakh
B. 18.6 lakh
C. 10.23 lakh
D. 9.6 lakh
E. None of these
Answer: Amount invested in 2004 and 2005
.png)
The ratio of number of students from Town B to that from Town A
Stay informed, Stay ahead, and Stay inspired with MBA Rendezvous.